Visionmaker NYC Version 1.0 Methods: Economics
Jason M. Barr, Ph.D.
Department of Economics, Rutgers University, Newark, Newark, NJ 07102
© Wildlife Conservation Society, 2015
Please submit comments or suggestions to m2409@themannahattaproject.org
Visionmaker NYC provides two types of costs related to each vision. First is the total construction cost of creating the vision. Second is the cost of demolishing the ecosystems that exist within the vision extent as of 2014. These costs only relate to any changes that are made within a particular vision relative to the base vision (i.e., the vision extent of 2014). Visionmaker lists 94 different elements that required costing. 87 of these were considered ecosystems in that they required modification of land itself (either by changing the land or building a structure on it). Seven elements were "modifiers," in that they were added to structures (such as cistern/rain barrel or photovoltaic panels).
Demolition Costs
For each ecosystem, we obtained reports or data on costs to demolish each one of the various ecosystems in Visionmaker. These reports were for projects throughout the U.S. within the last decade, and each price was converted to New York City 2014 dollars, as described below. In general, the cost estimates assume the destruction/ removal of the ecosystem in question and the grading of the property for new development.
By and large, these estimates assume standard or typical costs of demolition and trash removal. This is to say, all estimates implicitly assume that the material is hauled away and placed in a landfill. We assume that the building materials are not recycled or resold. The data do not assume major structural problem or large costs associated with toxin abatement (such as asbestos) and so on. Furthermore, we assumed there were no additional costs, such as Environmental Impact Assessments, legal fees, or any additional cost that might have be paid in a large demolition project in the city.
Modifiers that were found to be currently on a structure were assigned to have 0 demolition costs, as we assumed that they were embedded in the demolition cost of the ecosystem (structure) on which they were attached.
For the purposes of providing demolition costs, the 87 ecosystems can be divided into three basic types. Type I are the ecosystems that contain a structure or some development that needs to be removed, such as a building, railroad tracks, or a windfarm. For these cases we found data on the per square foot demolition costs or the total demolition costs divided by the square footage of the project, or land area on which the project exists. Type II relate to the removal of natural elements, such as trees, that needed to be removed. In these cases, we estimated removal per square foot or total costs divided by the land area. In cases where prices were given per unit (e.g. per tree), we estimated the number of trees per acres and created a per square foot cost. All of the assumptions are documented in Visionmaker's parameter database.
A third set of ecosystems were those that were not to be demolished per se, but rather were to be eliminated and have the site graded. These included wetlands, estuaries, and tunnels. In these cases, we had few actual costs projects to go by, and as a result, we simply calculated estimates of the total volume of the space, and assumed that the demolition costs are the combined costs of filling in the site with so many tons of sand and then graded and prepared for development. This assumption means that the demolition project is "done on the cheap." There are no Environmental Impact Assessments, retaining walls, piers, plumbing, pumps, etc.
Note that once per square foot costs were determined, they were then converted to per square meter costs to be in agreement with the measurement system used by Visionmarker.
Construction Costs
Similar to the demolition costs, we obtained per square foot cost estimates for creating all of the ecosystems and modifiers, on the assumption that the site was graded, cleared, and ready for development. We did not include any additional costs beyond the ones chosen by the Visionmaker system. That is, we assume, for example, that if user creates an apartment building then plumbing pipes and electricity cables already exist under the streets and are hooked up to the new unit. To keep things simple, we did not include transaction costs, financing costs, or any other fees that are directly related to the project. Also note if the original vision had some wetland, then the cost estimates for a new wetland or body of water means that first the users "pays" the demolition costs and then second pays the construction cost for the new wetland. Again, similar to the demolition costs, we converted costs to New York City 2014 dollars (see below). Similar to demolition costs, all per square foot costs were converted to per meter costs.
Building Height and Costs
In regard to building height, after some height, taller buildings become increasing expensive to construct on a per square foot basis. The reason is that as the structures become taller some costs increase at an increasing rate, thus causing the average costs to rise. In particular, taller buildings need more wind bracing, more elevators, stronger structural steel or cement, and larger or deeper foundations (Barr, forthcoming). To this end, we estimate how construction costs vary with building height.
The Data
The website www.emporis.com provides a data base of nearly all tall buildings constructed in New York City. From this website we were able to obtain the total construction costs, name, address, type, and year of completion for 21 tall buildings completed in New York City between 2001 and 2015. The buildings ranged in height from 25 to 104 stories.
We were able to obtain the gross building area from either the CTBUH's skyscraper database or the New York City Map Portal. Finally, we obtained the value of the New York City metropolitan area Consumer Price Index (CPI) from the Bureau of Labor Statistics. The CPI was adjusted to so that the year 2014 was set to one (and thus previous years had lower price levels). The real total construction costs were calculated by taking the nominal construction costs and dividing them by the CPI value in the year in which the building was completed.
We also included total costs for four more buildings based on construction budgets that were we received from a real estate company in New York. Because of a confidentiality agreement we provide the real costs per square foot and the building height but withhold other information. Please note that some of these buildings are under construction. Future real costs were projected by assuming that the CPI grows at an annual rate of 2% for the next few years. Table 1 gives the data for the buildings.
Processing and Estimation
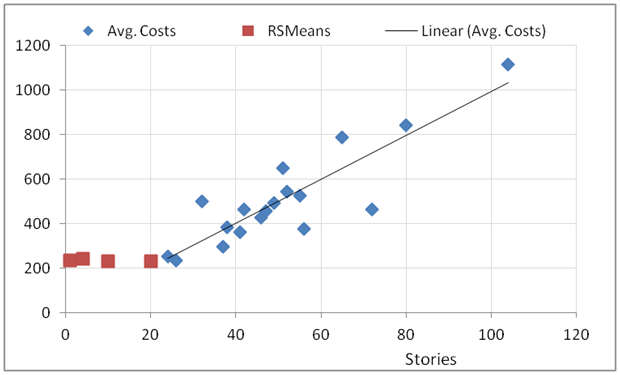
The data set contains a total of 26 buildings. However, from this we removed one building from consideration. This was the 40-story 11 Times Square, which was a severe outlier in terms of its construction costs (Pincus, 2009). For each building height, we took the average of real per square foot cost for that height (if there were multiple observations for a particular height). If there was only a single observation, we just included that observation. This gave a sample of 18 observations. Figure 1 shows these average costs plotted against building height. The black line is the trend line and this was estimated using ordinary least squares. Table 2 presents the estimated coefficients, the predicted cost values and the residuals. Figure 1 also provides the per-square-foot costs for office buildings between one and 20 stories, as estimated by RSMeans (2013).
RSMeans (2013) provides per square foot costs for buildings of different types of structures. Some structures, such as hospitals and data centers, have greater "base" per square foot costs, then do offices or apartment buildings, where the base costs represent the average per square foot cost for a low-rise version of the structure. Other structures, such as garages, have lower per bases. Table 3 provides information on the highest per-square foot costs for different types of structures under 25 stories. These represent our base costs. Note not all buildings types in Visionmaker are given in the table.
In order to estimate the costs of different types of structures of varying heights we applied the following rules:
- 1) If the building height was less than 25 stories, we used the maximum value of per-square foot costs for that building type, as provided by RSMeans (2013). So for example, for offices, the highest per square foot cost is a 2 - 4 story building (20,000 sq. ft.) at $183 per square foot. This gives a New York City base value of $240 per square foot.
- If a building was 25 stories are taller, we applied the following formula:
Per Square Foot Cost=(NYC base value-240+ 8.19)+(9.83*story).
For example, an office building of 50 stories will have estimated per square foot costs equal to 8.19+9.83*50=500.40. A 50-story hospital will have estimated costs equal to (446-240+8.19) +9.83*50=$705.69 per square foot. Once the per square foot costs were determined, they were converted to per square meter costs, by multiplying the results by 10.7639.
In other words, we use the office base price as the reference point, and costs are shifted up or down based on how much they deviate from the office base price. Also note that in this particular data set, there was no statistically significant difference in the costs between the building types in the data set. That is to say, in this data, offices, hotels and apartments, appear to have the same per square foot construction costs. RSMeans (2013), however, has apartment buildings having a higher base cost relative to offices; for consistency, we use this higher apartment base cost in the calculation. Note that formula also says that average square foot costs rise about $10 per story added to the building above 24 stories.
Location-Year Cost Conversions
Each ecosystem has one or more cost estimates for the cost to demolish that ecosystem and the cost to build it. These cost estimates were based on values obtained throughout the U.S. and since 1991, though mostly in the last five years. Since Visionmaker relates to costs in New York City in the present, it was necessary to adjust the costs across space and time so that they reflected New York City costs as of the end of 2014/early 2015. Thus, we created "conversion factors" so that each place-year cost can be adjusted to reflect New York 2014.
Location Conversion Factors
RSMeans (2013) provides a series of "location factors," which allow one to see how building costs differ across specific areas across the U.S., relative to average U.S. costs. For example, New Britian, CT has a location factor of 1.11 for residential costs. Thus, RSMeans (2013) calculates that building costs in New Britain are 11 percentage points higher than the national average. RSMeans (2013) gives location factors for both residential and commercial construction. We used the values from the residential column, though commercial values are quite similar.
For the cost analysis for Visionmaker2409, we used state averages for the location factors since we often had multiple cost estimates for each state. For New York City, RSMeans (2013) does not provide one New York City Location Factor, but rather provides several values within the city. To create the New York City Location Factor, we took the average values across the five boroughs.
Table 4 provides the locations and the average location factors for those locations (as of July 1, 2015). Again, each location factor is the cost of construction relative to the national average. Note that the New York City location factor is 1.312.
To convert a particular location to New York City costs, we applied the formula:
This converted a particular place's cost to New York City costs. For example, for a project in Vermont, the average location factor is 0.943, meaning that costs in Vermont are 5.7 percentage points less expensive relative to the national average. To convert Vermont costs to New York City costs we applied the formula 1.312/0.943=1.391. In other words, average construction costs are estimated to be 39.1% more expensive in New York City as compared to Vermont, on average.
Note that our conversion factors assume that the relative costs across regions do not change across years. That is to say, we assume that costs in Vermont have remained 39.1% less expensive across time. This is done for simplification, but we believe it to be a reasonable approximation for the time period under consideration.
CPI-Year Conversion Factors
Once each particular cost value was adjusted to New York City prices, we then adjusted this value for inflation, according to the New York City metro area Consumer Price Index (CPI) (see Table 5). For example, if the above Vermont cost was incurred in 2010, we first converted it to a New York City price and then adjusted that New York City price to 2014. Note that for simplicity, costs incurred in 2015 were assumed to have the same prices as 2014. This was done since costs for 2015 were likely posted early in the year and were likely very close to prices in 2014.
According to Table 5, the NYC CPI was 0.926 relative to 2014. Thus, we adjusted 2010 prices to 2014 by 1/0.926 = 1.08. That is, average prices have risen 8% between 2010 and 2014 in New York City.
In short, we created CPI-Year Conversion Factors by first adjusting the NYC CPI to have a value of 1 in 2014, and then we converted each year’s adjustment factor by the formula of 1/CPI Value for a particular year. See Table 5.
Location-Year Conversion Factors
Given the average location factor from RSMeans (2013) and the CPI-year factor, we created location-year conversion factors by multiplying the average Location Conversion Factor by the CPI-Year Conversion factor to convert a cost value across both time and space. Using Tables 4 and 5, any location-time conversion factor can be created by taking the Location Conversion Factor and multiplying it by the CPI-Year Conversion Factor.
References
Barr, J. M. (forthcoming). Building the Skyline: The Birth and Growth of Manhattan's Skyscrapers. Oxford University Press: New York.
Pincus, A. (2009). "Can 11 Times Square Hang On?" The Real Deal. Sept. 30. http://therealdeal.com/issues_articles/big-and-available/
RSMeans. (2013). Square Foot Costs 2014. RSMeans: Norwell.
Tables and Figures
Table 1: Data set of buildings used for analysis
| Building | Address | Type | Total Costs ($M) | Year Completed | NYC CPI (2014=1) | Gross Building Area 100K sq. ft. | Stories | Real Costs per Square Foot ($2014) |
|---|---|---|---|---|---|---|---|---|
| The Westport | 500 West 56th Street | Residential | 75 | 2003 | 0.76 | 3.910 | 24 | 252 |
| DoubleTree Hotel - Chelsea | 128 West 29th Street | Hotel | 17 | 2009 | 0.91 | 0.801 | 26 | 233 |
| 12 MetroTech Center | 330 Jay Street | Office | 360 | 2005 | 0.82 | 12.000 | 32 | 367 |
| The Alex Hotel | 205 East 45th Street | Hotel | 70 | 2003 | 0.76 | 1.449 | 32 | 635 |
| Capitol at Chelsea | 55 West 26th St | Residential | 76 | 2001 | 0.72 | 4.545 | 37 | 233 |
| The Helena | 601 West 57th St | Residential | 160 | 2005 | 0.82 | 5.472 | 37 | 358 |
| Lehman Bros Building | 745 7th Ave | Office | 250 | 2001 | 0.72 | 10.200 | 38 | 341 |
| Millennium Point | 25 Battery Place | Residential | 175 | 2001 | 0.72 | 5.750 | 38 | 423 |
| One Carnegie Hill | 215 East 96th Street | Residential | 103 | 2006 | 0.85 | 4.908 | 41 | 247 |
| Tower 31 | 9 West 31st Street | Residential | 98 | 2006 | 0.85 | 2.424 | 41 | 476 |
| The Marc | 260 West 54th | Residential | 76 | 2004 | 0.79 | 4.354 | 42 | 222 |
| 325 5th Avenue | 325 5th Avenue | Residential | 190 | 2006 | 0.85 | 3.174 | 42 | 706 |
| Hearst Tower | 959 8th Avenue | Office | 312 | 2006 | 0.85 | 8.639 | 46 | 426 |
| Times Square Tower | 7 Times Square | Office | 230 | 2004 | 0.79 | 10.794 | 47 | 270 |
| Seven World Trade Center | Seven World Trade Center | Office | 700 | 2006 | 0.85 | 16.811 | 49 | 491 |
| Random House Tower | 1745 Broadway | Office | 300 | 2003 | 0.76 | 8.600 | 52 | 459 |
| New York Times Tower | 620 8th Avenue | Office | 850 | 2007 | 0.87 | 15.457 | 52 | 631 |
| Bank of America Tower | West 42nd St | Office | 1000 | 2009 | 0.91 | 21.000 | 55 | 523 |
| Barclay Tower | 10 Barclay St | Office | 185 | 2007 | 0.87 | 5.650 | 56 | 375 |
| Trump World Tower | 845 UN Plaza | Residential | 300 | 2001 | 0.72 | 8.977 | 72 | 465 |
| One World Trade Center | One World Trade Center | Office | 3900 | 2014 | 1.00 | 35.013 | 104 | 1114 |
| Info withheld | Office | 1050 | 2011 | 0.95 | 9.732 | 40 | 1133 | |
| Info withheld | Office | 1214 | 2016 | 1.04 | 18.111 | 47 | 644 | |
| Info withheld | Office | 906 | 2017 | 1.06 | 13.183 | 51 | 648 | |
| Info withheld | Office | 2007 | 2014 | 1.00 | 25.499 | 65 | 787 | |
| Info withheld | Office | 2552 | 2018 | 1.08 | 28.039 | 80 | 841 |
Table 2: Results of Ordinary Least Squares Regression
SUMMARY OUTPUT
Dependent Variable: Real Construction Costs per Square Foot ($ 2014)
| Regression Statistics | |
|---|---|
| Multiple R | 0.878 |
| R-Square | 0.771 |
| Adj. R-Square | 0.757 |
| Standard Error | 109.0 |
| Observations | 18 |
| Coefficients | Standard Error | t Stat | P-value | |
|---|---|---|---|---|
| Intercept | 8.19 | 72.84 | 0.11 | 0.91 |
| Stories | 9.83 | 1.34 | 7.35 | 0.00 |
| Observation | Predicted Avg. Costs | Residuals |
|---|---|---|
| 1 | 244 | 8.28 |
| 2 | 264 | -30.63 |
| 3 | 323 | 178.51 |
| 4 | 372 | -76.77 |
| 5 | 382 | 0.37 |
| 6 | 411 | -49.60 |
| 7 | 421 | 42.72 |
| 8 | 460 | -34.02 |
| 9 | 470 | -12.94 |
| 10 | 490 | 1.11 |
| 11 | 510 | 138.01 |
| 12 | 519 | 25.40 |
| 13 | 549 | -25.59 |
| 14 | 559 | -183.19 |
| 15 | 647 | 140.04 |
| 16 | 716 | -251.17 |
| 17 | 795 | 46.11 |
| 18 | 1031 | 83.36 |
Table 3: Examples of building types and based costs from RSMeans(2013) for 2014
| Building Type | U.S. Base Cost ($ / sq. ft.) | NYC Base Cost ($ / sq. ft.) |
|---|---|---|
| Garage | 65 | 85 |
| Warehouse | 108 | 141 |
| Factory | 135 | 177 |
| Retail building | 145 | 189 |
| Office | 183 | 240 |
| School or university | 190 | 248 |
| Hotel | 205 | 268 |
| Restaurant | 220 | 288 |
| Apartment building | 230 | 301 |
| Computer data center | 305 | 400 |
| Hospital | 341 | 446 |
Table 4 Average Location Factors from RSMeans (2013) and Location Conversion Factors, which converts a particular location’s prices to New York City Prices
| Location | Avg. RSMeans (2013) Factor | Location Conversion Factor |
|---|---|---|
| AK | 0.742 | 1.769 |
| CA | 1.115 | 1.177 |
| CT | 1.109 | 1.183 |
| FL | 0.843 | 1.556 |
| IL | 1.086 | 1.208 |
| MI | 0.941 | 1.394 |
| MT | 0.879 | 1.493 |
| NC | 0.839 | 1.563 |
| NV | 0.978 | 1.342 |
| NY | 1.117 | 1.174 |
| NYC | 1.312 | 1.000 |
| OK | 0.782 | 1.678 |
| PA | 0.958 | 1.370 |
| TX | 0.766 | 1.713 |
| US | 1.000 | 1.312 |
| VT | 0.943 | 1.391 |
| WA | 0.981 | 1.337 |
Table 5: New York City Consumer Price Index (source Bls.gov) and CPI-Year Conversion Factor.
| Year | CPI (1983=100) | CPI Adjusted so that 2014=1 | CPI-Year Conversion Factor |
|---|---|---|---|
| 1990 | 138.50 | 0.532 | 1.879 |
| 1991 | 144.80 | 0.556 | 1.797 |
| 1992 | 150.00 | 0.576 | 1.735 |
| 1993 | 154.50 | 0.594 | 1.684 |
| 1994 | 158.20 | 0.608 | 1.645 |
| 1995 | 162.20 | 0.623 | 1.604 |
| 1996 | 166.90 | 0.641 | 1.559 |
| 1997 | 170.80 | 0.656 | 1.524 |
| 1998 | 173.60 | 0.667 | 1.499 |
| 1999 | 177.00 | 0.680 | 1.470 |
| 2000 | 182.50 | 0.701 | 1.426 |
| 2001 | 187.10 | 0.719 | 1.391 |
| 2002 | 191.90 | 0.737 | 1.356 |
| 2003 | 197.80 | 0.760 | 1.316 |
| 2004 | 204.80 | 0.787 | 1.271 |
| 2005 | 212.70 | 0.817 | 1.223 |
| 2006 | 220.70 | 0.848 | 1.179 |
| 2007 | 226.94 | 0.872 | 1.147 |
| 2008 | 235.78 | 0.906 | 1.104 |
| 2009 | 236.83 | 0.910 | 1.099 |
| 2010 | 240.86 | 0.926 | 1.080 |
| 2011 | 247.72 | 0.952 | 1.051 |
| 2012 | 252.59 | 0.971 | 1.030 |
| 2013 | 256.83 | 0.987 | 1.013 |
| 2014 | 260.23 | 1.000 | 1.000 |
Figure 1: Average per square foot costs ($) in New York City versus building height